Open source live solar mapping
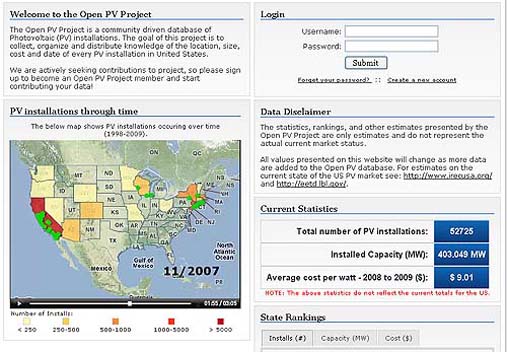
The Open Source Live Solar Mapping Project, recently released by the National Renewable Energy Laboratory, tracks private installations of photovoltaic (PV) solar panels by location in the US and maps them in time. The map-video, spanning from 1998 to the present day, highlights the spatial concentration of solar energy harvest with changing colors that indicate the number of PV installations in each state. Solar energy has been identified as the world’s fastest-growing energy technology, with the number of photovoltaic installations doubling every 2 years since 2002. The Solar Mapping Project is community-driven, relying on information submitted by individuals, industry professionals and government officials.
(via Clean Technica)


